Optimizing a Tail for Low Drag: Part 3
Initial
Testing
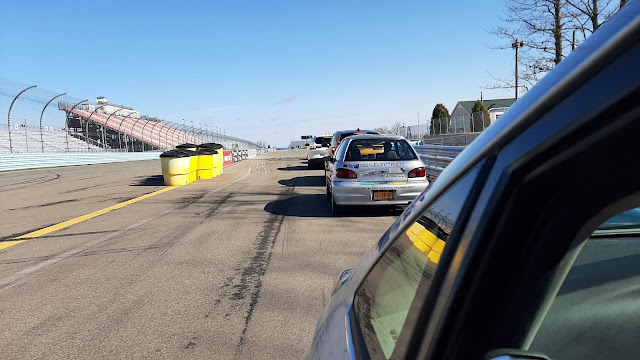
To start
the process of designing a drag-reducing tail, I threw together some boards
that would give me some adjustability of their angle relative to the rearmost
surfaces of my car. Then I headed out on the road for initial testing.

Before you
start testing, it’s important to recognize potential shortcomings and what your
tests can actually show you (as well as what they can’t). In this case,
separate boards at the top, bottom, and side of my car do not replicate
a complete, solid tail; rather, I’m using this test to get an idea of what
might be appropriate dimensions and taper angles to start my investigations of
a full tail. I’ll use these data to try and predict the drag changes from the
various angles and then use those as a jumping off point to design the real
tail rather than just guess at a shape.
You will
see people misunderstand this all the time online. Commonly, someone will make
a change to their car and then use one tank’s measured gas mileage as “proof”
it worked. Don’t fall for this! Often, the claims made from this sort of “test”
are unbelievably large in comparison to the change made, and the test can’t
actually show what the tester thinks it can. For instance, before I start in on
this tail I added outboard diffuser extensions to my car (outermost boards/vanes here):

Keeping in
mind what I want to learn from these tests and how I want to use that
information, I headed out on the road.
Pressure
Measurement
First up,
I measured aerodynamic pressure on each board
toward its trailing edge as I varied its orientation. The way these boards are
cobbled together didn’t really allow for fine adjustments, so the angle changes
ended up being quite large—but the results were still informative.
I tested
on a N-S road on a day with winds out of the SSW at ~10 mph. So, the yaw angle
and freestream speed are different for each direction here—differences that
show up in the results.
Top board:

Bottom
board:

Side
board:

One
curiosity: the spike in negative pressure at 10° inward slant (where 5° is
approximately aligned with the bumper cover side). Concerned this might be an
error, I ran that test again in both directions and got the same result. That
sticks out as an angle I probably want to avoid in my tail design.
In
addition to the above, I measured the base pressure on the bare car (in the
center of the license plate) and found that it was -40 Pa southbound and 0 Pa
northbound:
In the
meantime, I can conclude the following from these tests:
-drag reduction from pressure recovery on this tail will likely come from its upper surface more than from the bottom or sides
-any pressure recovery is likely to be a lot smaller than “theory” suggests


|
Angle from Horizontal |
South (Pa) |
North (Pa) |
Average (Pa) |
|
-13° |
0 |
-10 |
-10 |
|
-24° |
-10 |
0 |
-10 |
|
-34° |
-20 |
0 |
-10 |

|
Angle from Horizontal |
South (Pa) |
North (Pa) |
Average (Pa) |
|
+2° |
-40 |
-10 |
-30 |
|
+16° |
-30 |
-20 |
-30 |
|
+34° |
-40 |
-10 |
-30 |
|
+44° |
-40 |
-10 |
-30 |

|
Angle from Centerline |
South (Pa) |
North (Pa) |
Average (Pa) |
|
0° |
-30 |
-40 |
-40 |
|
-5° |
-40 |
-20 |
-30 |
|
-10° |
-60 |
-20 |
-40 |
|
-18° |
-20 |
-40 |
-30 |
|
-25° |
-40 |
-40 |
-40 |
|
-31° |
-40 |
-40 |
-40 |
 |
| You would be surprised how many people ask me what OPEC means. |
-drag reduction from pressure recovery on this tail will likely come from its upper surface more than from the bottom or sides
-any pressure recovery is likely to be a lot smaller than “theory” suggests
Unfortunately,
without more pressure recovery this tail won’t even come close to my drag
reduction goal. If the full mockup doesn’t develop higher pressures, I’ll have
to investigate shape changes to try and increase them.
Tuft
Testing
Second, I
went out on another day and had a friend drive my car while I took photographs
of tufts taped to the top, bottom, and side boards at various angles.
There was
a fairly gusty wind that day, 15-20 mph out of the NW. Despite the yawed flow,
the tufts showed attached flow in more configurations than I expected.
I couldn’t
see until I reviewed the burst images at home later, but the bottom board had
attached flow in its lowest position (it sagged a bit during testing). That
flow separated if the board was angled upward at all:


Analysis
Now that I
have some data to work with, I can try and predict how a tail will perform and
use that as a starting point for my next test buck. To do this, I wrote
a Python program to calculate total base pressure drag as a function of top
board angle, top board measured pressure, bottom board angle, bottom board
measured pressure, side board angle, and side board measured pressure
(approximating pressure as constant over the entire surface area of each part
of the tail). Pressure drag is the sum of each pressure multiplied by the
surface area of each part normal to the x-direction i.e. in the yz-plane,
giving the x-component of the force developed by the pressures acting on the
slanted areas (I won’t bother here, but you can prove this relationship with
simple trigonometry). Each of those areas changes, as well as the remaining
vertical base area, with change in the boards’ orientations, and of course the
measured pressures change as well—which means this is a lot easier to let a
computer sort out and spit out an answer.

Keep in
mind, too, that these are only general estimates; I’ve made a lot of
assumptions (and ignored things like shear stress drag) to try and roughly predict
what a real tail will do. But that’s fine; I’ve only begun testing at this
point, and as I continue to test and measure, I will refine my parameters for a
final design. These initial tests are just a starting point.


Previous: Optimizing a Tail for Low Drag: Part 2


Comments
Post a Comment