Three-Dimensional Flow Fields
Every day, it seems, I understand something new I had
failed to grasp before—especially in aerodynamics. For example, take this
statement:
"Once again, it is necessary to remember that road vehicles and their air flow patterns are highly three-dimensional" (Barnard 15, emphasis added).
This always bothered me a little. Of course the
flow over cars is 3-dimensional, I thought; how on earth can something be more
or less, let alone highly 3D? Isn’t flow just...3D or not 3D?
Well, a few weeks ago in an Incompressible Flow lecture I
finally understood it. Now you can too.
 |
| Investigating the veracity of Barnard's claim. I've done this before, and have yet to find him wrong. |
(*Note that an approximation of viscosity as constant does not mean that shear stress, which gives rise to friction drag, is zero or constant! Shear stress is a function of viscosity and the derivative of velocity with respect to displacement—that is, the change in velocity with change in height from the body surface in the boundary layer. Where the flow speed at the upper edge of the boundary layer is faster, the change in velocity per change in height will be greater--and friction drag will be greater).
 |
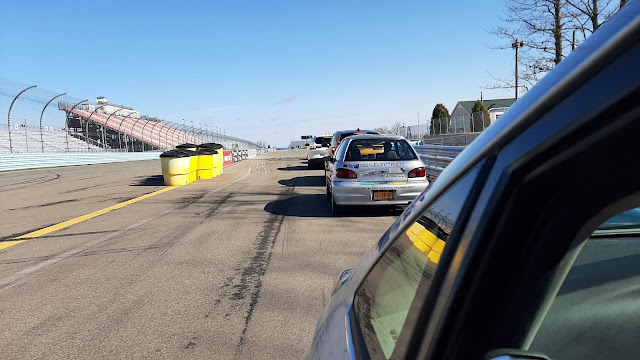
| Look at these tufts on the bumper cover and hood, for example: any tuft in particular has a direction backward, upward, and to the side. |
 |
| The gradient of a vector, such as velocity, gives a tensor. Each row represents the change in x, y, and z components of velocity; each column represents the change in x, y, and z components of position. Thus, the first row shows the change in x-velocity per change in x, y, and then z, and so on. |
Some simple testing on your own car will illustrate this.
I’ll use mine as an example.
Pressure Field
For this first example, consider a coordinate system
aligned not with the car body and road but a specific panel on it—here, the front
windscreen. Let’s approximate the windscreen as a plane (a flat surface—a reasonable approximation here, since the windscreen on this car is nearly flat). I’ll
measure pressures down an arbitrary line on the windscreen, which returns these
values (80 kph, two-way average):
 |
| I laid out a set of points on a 200mm grid before going out to measure. You can save time during testing by prepping as much as you can beforehand. |
 |
| Centerline pressure profile of a NACA 2415 airfoil. For wings of long span, a 2D approximation like this is often valid for sections of constant chord in the middle of the wing. |
But does this give us a full picture of the flow over a car? In a
word, no. Rather, depending on how we orient our coordinate axes, this shows us
either a 1D or 2D field. The values above from my car, plotted against position along the
plane coinciding with the windscreen, gives a function of position in one
dimension:

It's very easy to assume that these pressures don't vary side-to-side since I only have information front-to-back and bottom-to-top. That may or may not be the case, though. If it is, then the flow is 2-dimensional. If it isn't, and the pressures actually change in a side-to-side direction as well as front-to-back and bottom-to-top, then it is 3-dimensional. To fully characterize the pressure field, then, I
actually need to take measurements in all three directions—two
directions aren’t enough:


Plotting local velocity against gauge pressure tells us what the flow speed is at any point on the windscreen based on the pressure reading there:

This gives the velocity field over the windscreen:

Note that these velocities are not representative of the flow speed at the body surface itself (which is zero, due to the no-slip boundary condition at a wall); rather, they indicate the speed of the flow at the upper edge of the boundary layer at each measurement location. Where the velocity is higher, friction drag will be higher than at locations with lower velocity due to the larger velocity gradient (du/dy) within the boundary layer. We're able to calculate velocity by measuring pressure due to the fact that pressure at the upper edge of the boundary layer and at the body surface are the same at any given point (i.e. normal vectors within the boundary layer are isobaric).
Lesson
Fundamentally, velocity and pressure fields over a car
are important because they determine its aerodynamic characteristics.
Integrated over the entire car, pressure gives a resultant pressure force, and
velocity determines the resultant friction force (from shear between fluid
“layers” due to viscosity, not to relative movement between air and the
surface). Both of these forces can be summed into one
aerodynamic force, which can then be divided into its components in the lateral
direction (side force), vertical direction (lift), and longitudinal direction
(drag).
The lesson here is: beware trying to characterize your
car’s flow field based on 1D or 2D measurements. They might give you information but only by extrapolation, and that extrapolation could very well be
wrong (for example, I had no idea there was such a large pressure gradient side-to-side across the windscreen of my car!). As always, you will have to balance your desire for information from
testing with the unpredictability of test conditions in the real world and ability to go quickly to compensate. And now that I’ve
understood this, I intend to be more cognizant of it going forward. Live and
learn.


Comments
Post a Comment