Tuft
testing is an experimental methodology most amateur aerodynamicists are
familiar with, even if the vast majority of them have never actually tried it. This
is too bad, since tuft testing can give us a lot of good information about the
quality of the flow over a car.
We
all know that this involves taping bits of yarn to your car, like what the
actors playing Carroll Shelby and crew do to the Ford GT in a (comically
reductive) scene in Ford v. Ferrari (2019). The tufts as depicted in
that film are pretty much useless for trying to determine what the "engineers" were
attempting to ascertain (magnitude and direction of front lift), but in real life they can be
tremendously instructive if applied with purpose and interpreted correctly. So,
what is the physical explanation behind tuft testing, why does it work, and
what can it actually tell us?
Stress
To
explain tuft testing, we first need to define some terms and concepts,
beginning with stress.
Divide
force by area and, if that force is not applied directly perpendicular to a surface, we get not "pressure" but stress. "Stress" refers to a force
exerted over an area in an arbitrary direction. Pressure is one component of
stress, normal (perpendicular) to a surface. The other component is shear,
which acts in orthogonal directions along the surface or, in other words, tangent
to it.
 |
| When the force is exerted directly perpendicular to the paper, it creates only pressure stress at the point of contact (upper image). The more general case is a force exerted at some oblique angle, in which case there are normal (pressure) and tangential (shear) stresses (lower image). |
Shear
Shear
stress is the component of stress acting tangent to a surface (the dashed green and blue arrows in the second image above), and that surface can be solid or fluid. Wherever moving
air touches a car body, for example, the fluid exerts stress that acts both
normal and tangential to the body. Normal stress (pressure) is usually
designated p; shear stress is usually designated τ ("tau"). The
general variable for stress is σ ("sigma"), usually accompanied by
subscripts x, y, or z. You may see normal and tangential
stresses identified in this last way, with the first letter in the subscript designating
the surface and the second letter indicating the direction of the stress
component e.g. σyz acts on the plane normal to the y
axis in the direction of the z axis and is thus a shear stress. These
stresses are commonly represented in a stress matrix where each row is
one face of a cube element (assumed in equilibrium) and each column is a
direction:The
diagonal of this matrix is pressure: stress on the x face (that is,
defined by a normal vector along the x dimension), pointing in the
direction of x, for example. Using matrices like this, various
calculations can be performed such as the determination of the principal stress
direction (orange arrow in the image above) by matrix rotation; once the principal stress direction has been found, we can rotate our coordinate system to align with it to make calculations easier. This is also possible to do geometrically, using "Mohr's circle." You may have heard of this in connection with tire traction but
that is not its intended application! It was developed for internal stress
calculation in materials engineering.
Shear
stress also acts between the "layers" of moving air. Wherever these layers move
at different speeds, there is friction between them and the friction stress
vector points in the same direction as the local flow. This friction between
air layers is especially important in the boundary layer, where there is a
velocity gradient (change) as the velocity increases from 0 at the surface to
freestream speed some distance away, and in regions of separated flow.
 |
| (M. Clarke, AE416 Applied Aerodynamics Class Notes, University of Illinois, Fall 2025). |
Tufts
Tufts
are short lengths of yarn or string taped to a surface to show the direction of
flow. How does this work?
We've
seen so far that shear stress on a surface or in an airflow always has a
magnitude (strength) but also points in a direction. The direction of shear in
airflow is always aligned with the local velocity. Since velocity at the surface
where the tufts are taped imposes shear on not just the body but also the yarn or string,
the tufts are pulled in the same direction as the flow by the local shear
stress (this is true as well if the tufts are taped to something like a fishing
line or wire grid, or are otherwise left in freestream; the local shear imposed by the velocity acts on
the tufts due to friction with the tufts themselves). So, tufts taped to a car body can show us the direction of flow wherever
we place them. This is commonly called "tuft testing." Because tuft testing does not return a numerical measurement value, it is a form of qualitative testing but it is no less important than quantitative measurements like static or total pressure.
Tuft
Testing
Because
the tufts align themselves with the local direction of shear, we need them to
be short enough that the shear direction doesn't change much over the length of
the tuft.
When
the tufts are short enough, they show "streamlines" or lines that are tangent
to instantaneous velocity everywhere in the flow. In a steady flow (one that
does not change over time), streamlines are the same as streaklines and
pathlines, like the trails traced out by smoke in a wind tunnel. Turbulent flow
(like over most of a car's surface) is not steady by definition but on average
we can sometimes consider it steady—which means if you look at tuft directions
averaged over some time interval we can usually consider them as representing the local
instantaneous velocity and hence approximating streamlines.
Tuft
length is important. It's common to see tuft tests conducted using pieces of
yarn that are verging on too long; if you can see
the yarn following the surface curvature but still twisting or bending around
over the length of a single tuft, you need to cut them shorter (I've found that 2"-3" is about the right compromise between keeping the tufts short while having enough length to ensure they are visible to a camera). If your tufts
are the right length, each one will point in essentially a short, straight
line.
Why
tuft test at all? What can it show us? First, tuft testing is perhaps the easiest
method of flow visualization—a way of "seeing" what otherwise invisible airflow
is doing. Tuft testing is used for this purpose by everyone from enthusiasts to
NASA engineers:
 |
| F/A-18 Hornet research vehicle flow visualization (image credit: NASA). |
Visualizing flow like this allows us to see the streamline patterns and flow direction over the vehicle's surfaces.
Second,
and perhaps more importantly, tuft testing allows us to identify areas of attached
and separated flow. When a boundary layer follows a surface, it is said
to be attached; even if the surface gently bends or curves away from the direction of
local airflow ahead of it, the boundary layer (and inviscid flow outside the
boundary layer) bend to follow it—a phenomenon called the Coanda Effect.
However,
if the boundary layer has lost enough streamwise momentum/dissipated enough energy, it no
longer follows the surface curvature and can detach. If this happens, the boundary
layer is said to be separated. Separation can be roughly predicted by a value
called the "shape factor" H,
where
δ* is the boundary layer displacement thickness and θ
is the boundary layer momentum thickness. When H becomes large enough (in other words, when enough streamwise velocity in the boundary layer has been lost),
the boundary layer tends toward instability and separation. (You may recognize H
as a term in the von Kármán Momentum Integral Equation, which can be used to predict
friction drag).
When the boundary layer separates, the flow near the body surface reverses direction, something that is immediately identifiable in tuft behavior. In practice, this looks like the tufts being pulled backward (against freestream flow direction) and flapping around, sometimes even standing straight up. Let's look at some examples.
Examples
 |
| Burst mode on a cell phone camera can be used to capture a quick succession of tuft images on a car as it passes. |
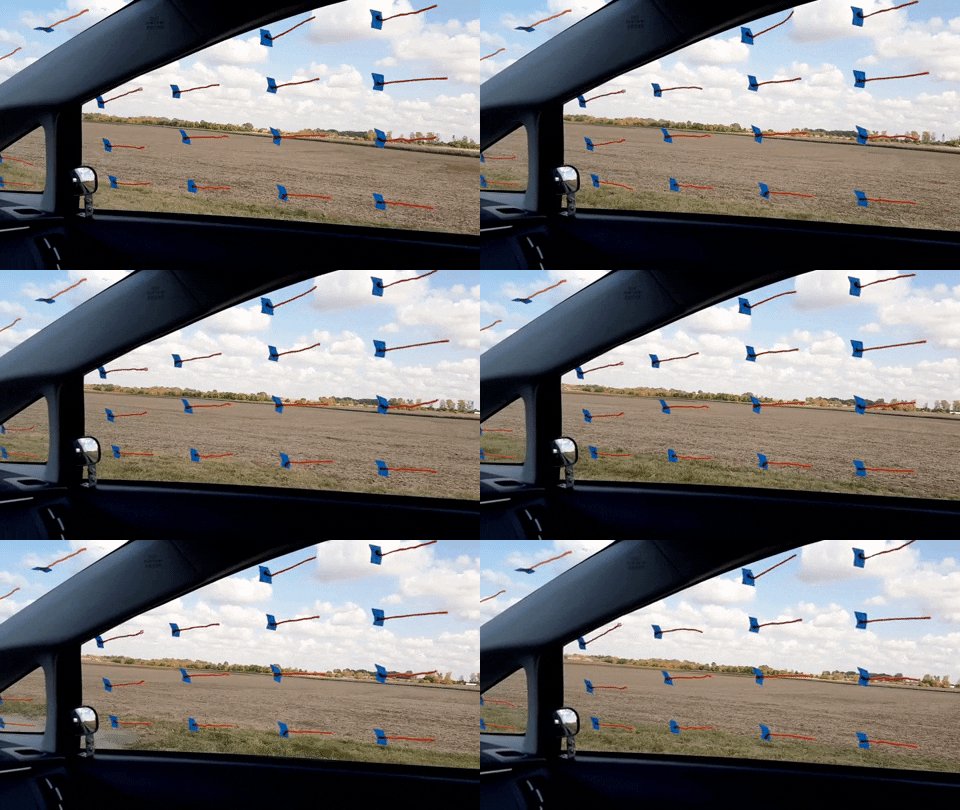
 |
| Small sections can also be photographed or recorded on video. If the area of interest is a window, this is easy to do from inside the car. |
 |
| Tufts can be used to check for separation and attachment. Here, the attached flow over the hood in stock configuration (upper image) has been deliberately ruined by fitting a mock bug deflector (lower image). |
 |
| On the same truck, tufts taped to the bed show the recirculation behind the cab. Notice the tufts pointing forward on the bed floor and tailgate. |
 |
| Choosing the right position from which to photograph can make all the difference. Here, I positioned myself at the side of the road and down low to capture tuft behavior not just around the cooling air inlet but underneath the splitter and on the engine undertray. |
 |
| Tufts are useful in wind tunnel experiments as well. This Clark Y wing section shows the difference in flow at low angle of attack (6°, upper image) and high (26°, lower image). Almost the entire upper surface of the wing is in separated flow at the higher angle; this is called stall. A common misconception is that, in stall, the wing completely loses lift; this is not true at all. This wing had about the same sectional lift coefficient at both angles of attack, just over Cl = 1.0 (but much higher maximum lift between these two, at α = 14° and Cl = 1.5). |
Go
try tuft testing on your car!


Comments
Post a Comment