Coast Down Testing Revisited
In my previous post about measuring changes in drag, I discounted coast down testing as an unreliable method. I called it that because I had tried coast downs several times and never got usable results. There were several reasons for this that I have been thinking about recently as I search for a method of measuring drag changes on my car. First, I was not good about keeping test parameters consistent; second, the tests themselves were not constructed properly; and third, I was trying to use the test results to calculate things (like drag coefficient) that relied too much on assumptions and were too small to reliably figure from this sort of testing on public roads, which naturally has high variability.
I decided to revisit coast down testing and see if I could
design and execute a test in such a way that the results could be trusted and
could show me whether the aerodynamic drag of my car has changed. Here's how I
did it, and how you can too.
Concept
The concept behind coast down testing is simple, and can be illustrated with a simple engineering method. In engineering dynamics,
we can calculate the forces and moments acting on a body by
using diagrams and relating them to Newton's Second Law of Motion (F = ma). Basically, the left side (a "free
body diagram") represents all the external forces and moments acting on a body as
vectors (free body diagrams do not include internal forces! So we don't
draw, for example, the sprung weight of the car acting on the suspension). The
right side (a "kinetic diagram") represents masses, inertial moments, and accelerations:

{y: NA + NB – W = 0
acceleration = (final velocity - initial velocity) / (elapsed time)
When I calculate a by subtracting initial from final velocity, it will come out with the correct sign, negative, since final v is less than initial v.
If we then make a change to the car that alters its
aerodynamic characteristics and assume that rolling resistance doesn't change
(another simplification), this should show up as a change in its acceleration. If the car takes longer to slow, the magnitude of acceleration (its size regardless of sign) is smaller and drag
has gone down—and vice versa. Easy peasy.
· keep the test as short as possible
· test at the highest (legal) speed possible
· test on the flattest road
· test in the calmest conditions
· start the test at exactly the same place
· start the test at exactly the same speed
Keep everything as
consistent as possible. As I see it, the best way to get that consistency is to
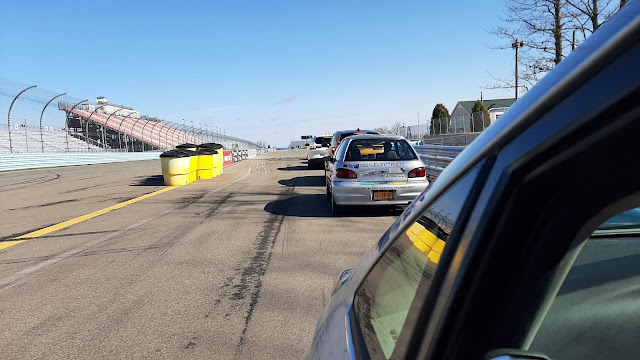
test in the same direction over the same exact stretch of road (the flattest road you can find!) in a short period of time. Additionally, I waited for a calm day to ensure that any wind effects are minimized or eliminated (Aerodynamics of Road Vehicles recommends testing with no wind as the best method, better than wind-averaging). Next time I do this, I might try running tests in opposite directions, in sets (i.e. standard/windows down in one direction, then standard/windows down in the other direction) on this same road and see what the difference is.
Did it work?
My question going into this was, would controlling as many
factors as I could and asking the right questions get me reliable results this time? I first tested the car in "standard" configuration ("nothing added, nothing taken away"),
then rolled down all the windows; this is a good check since we know it will
increase drag, by 6-12% on most cars. Then I taped on the
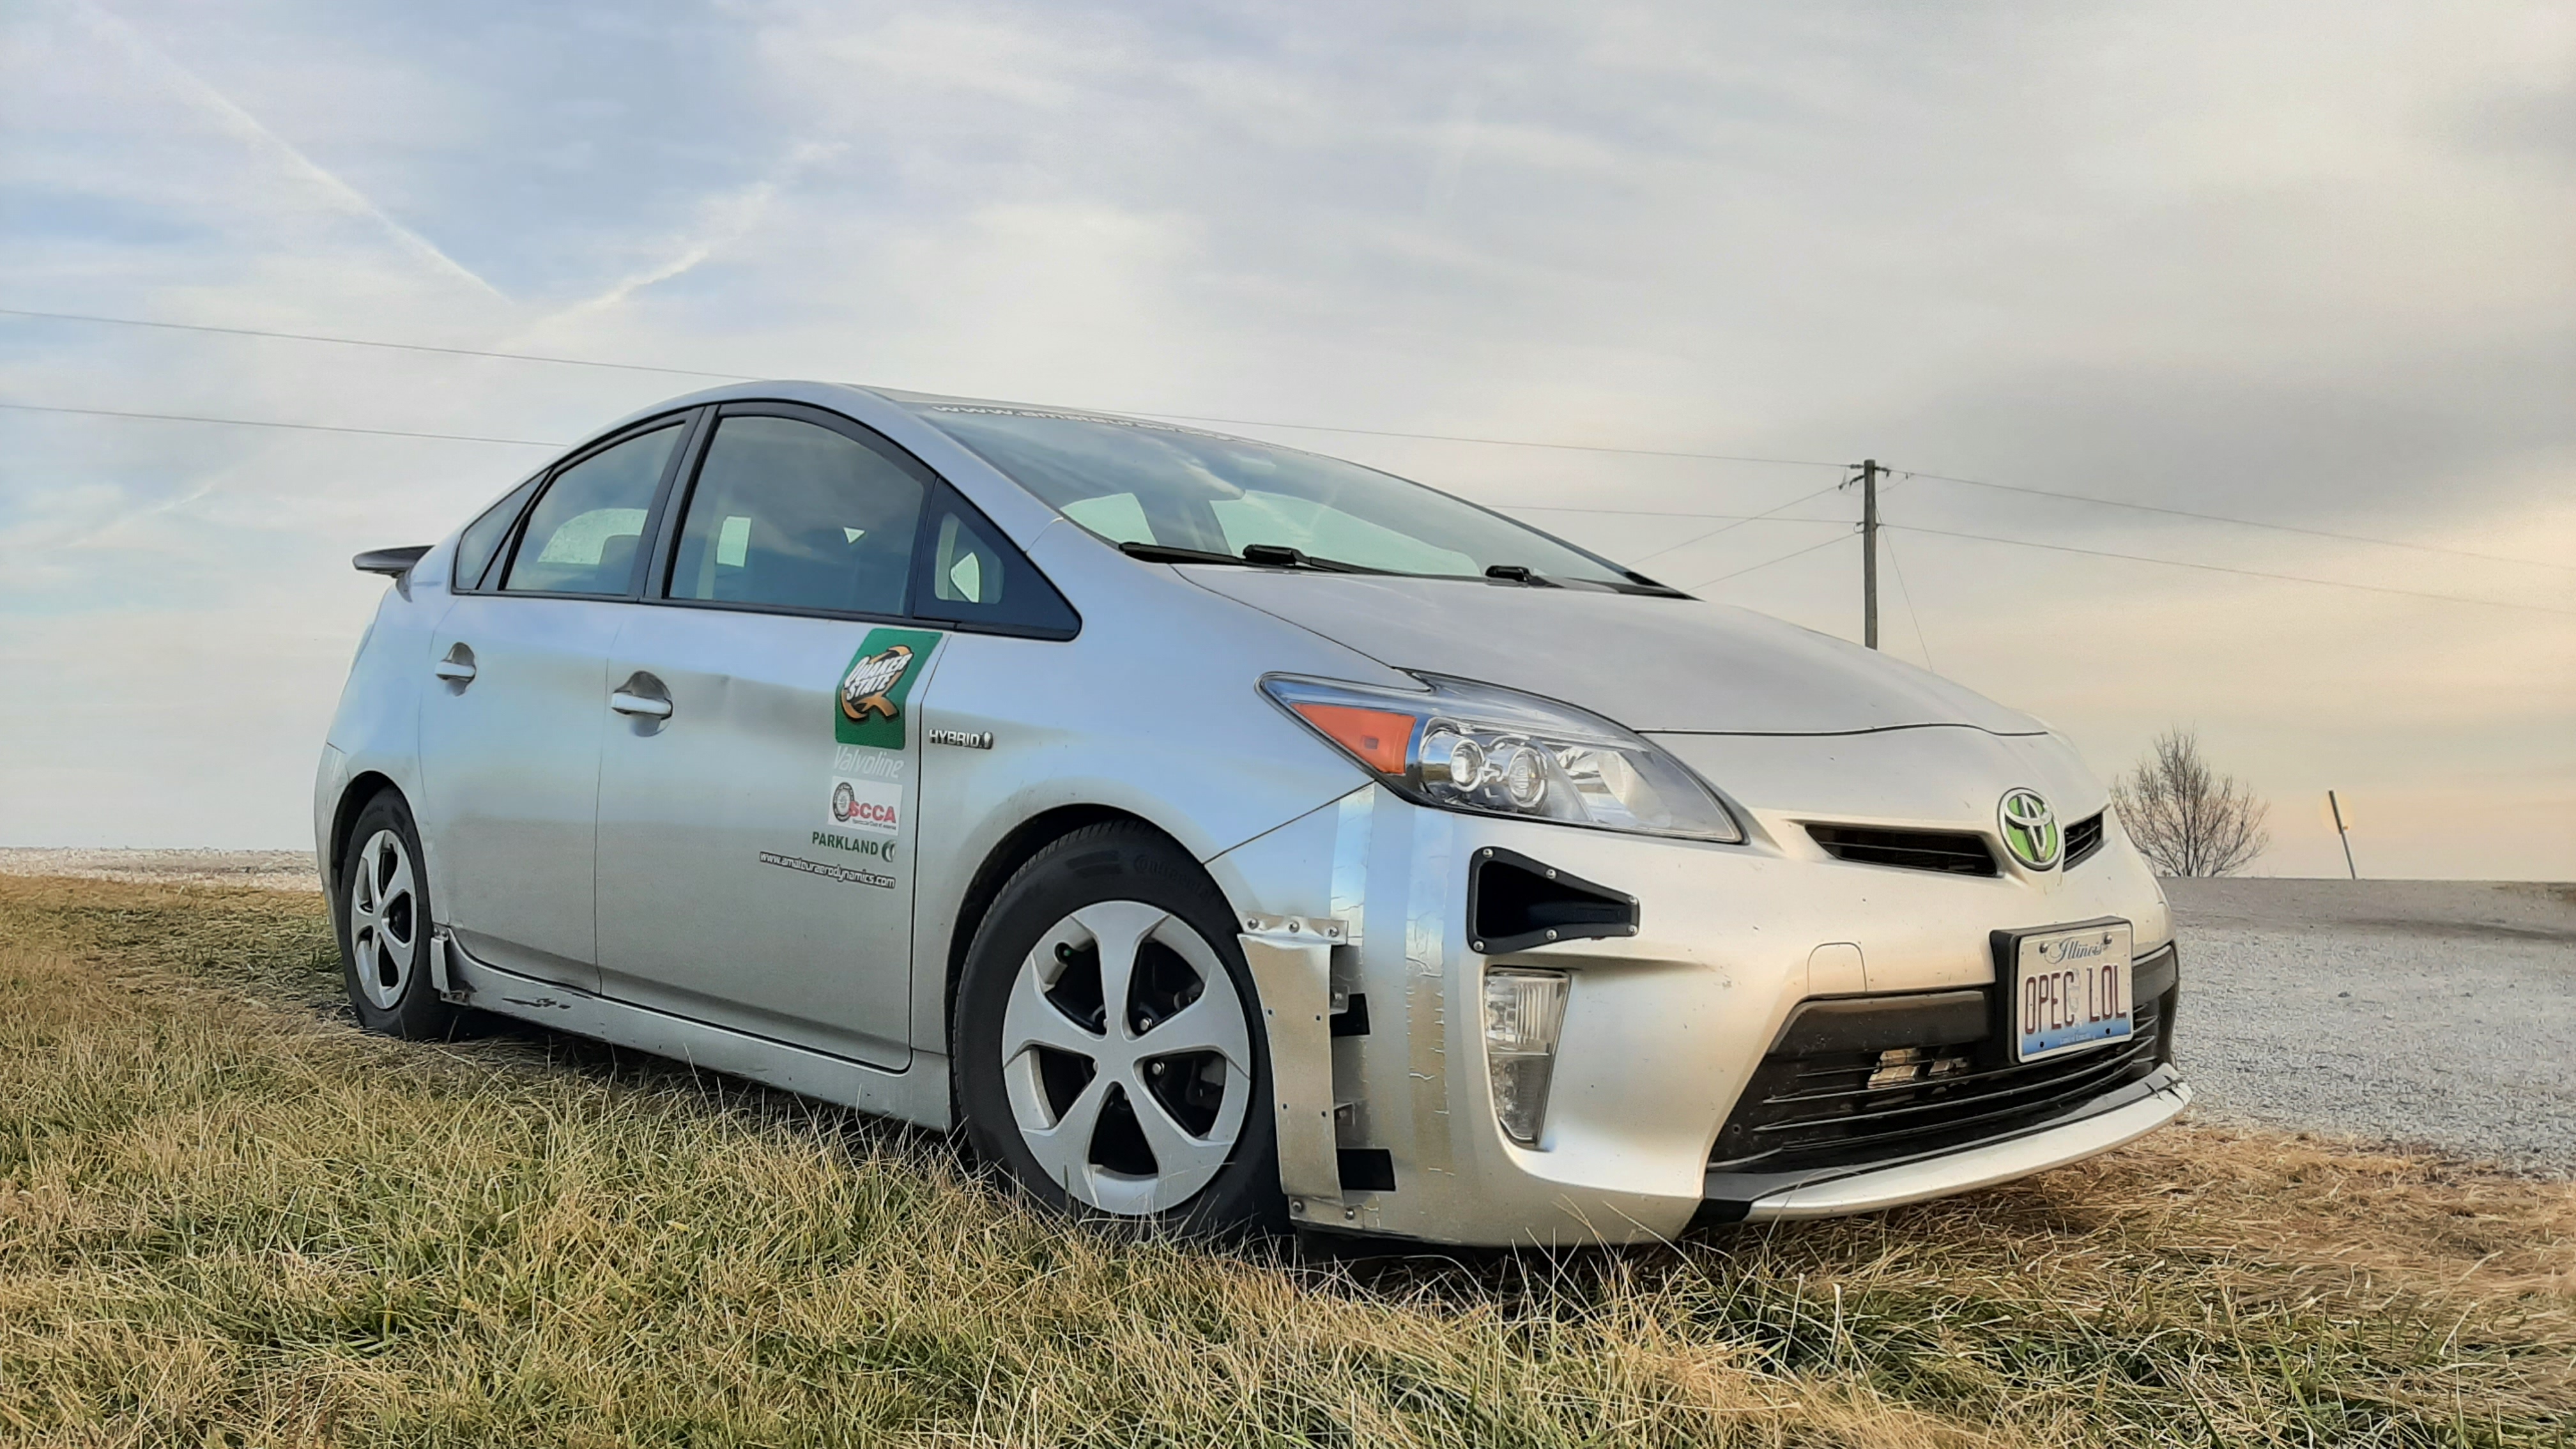
Hellcat spoiler I've been testing (with the windows rolled back up). My
estimate of drag change from pressure measurements indicates that this spoiler
should increase drag by 15% or more—significantly more than rolling down the
windows. That will serve as an additional check; if my results are trustworthy, they should show that
the increase in drag from windows down or the Hellcat spoiler compared to
standard are measurable and consistent, and they should also show that the spoiler increases
drag compared to windows down.
 |
| I really hate the test results I keep getting for this spoiler because I think it looks damn cool. |
|
|
Standard (110-100kph) |
Windows
(110-100kph) |
Hellcat (110-100kph) |
Standard
(100-90kph) |
Windows (100-90kph) |
Hellcat
(100-90kph) |
Standard (110-90kph) |
Windows
(110-90kph) |
Hellcat
(110-90kph) |
|
1 |
7.51 |
7.72 |
7.15 |
9.48 |
8.71 |
8.37 |
16.99 |
16.43 |
15.52 |
|
2 |
8.35 |
7.85 |
7.15 |
9.67 |
9.37 |
8.52 |
18.02 |
17.22 |
15.67 |
|
3 |
8.16 |
8.01 |
7.20 |
9.95 |
8.96 |
8.04 |
18.11 |
16.97 |
15.24 |
|
4 |
8.48 |
7.57 |
7.19 |
9.94 |
8.94 |
8.40 |
18.42 |
16.51 |
15.59 |
|
5 |
8.31 |
8.02 |
6.94 |
9.89 |
9.25 |
8.12 |
18.51 |
17.27 |
15.06 |
|
6 |
8.62 |
8.03 |
6.98 |
|
8.90 |
8.14 |
|
16.93 |
15.12 |
|
mean |
8.24 |
7.87 |
7.10 |
9.79 |
9.02 |
8.27 |
18.01 |
16.89 |
15.37 |
|
a (est.) |
-0.34 m/s2 |
-0.36 m/s2 |
-0.39 m/s2 |
-0.27 m/s2 |
-0.31 m/s2 |
-0.34 m/s2 |
-0.31 m/s2 |
-0.33 m/s2 |
-0.36 m/s2 |
Okay, you might be saying, but what about changes in drag smaller than opening all the windows? In the case that the change in drag, if any, is too small to measure this way, the statistical test will return a p-value greater than 0.05; there will be insufficient evidence to claim that the population means are different. There will be a lower limit to what these coast down tests can show, and when that happens I'll resort to other methods such as pressure measurement to determine what's happening to the airflow over the car and extrapolate the changes to drag and lift as I've been doing. Additionally, when I coast down test in the future I'll always start with a "windows down" test to verify that my results are trustworthy in that session.
Conclusion
In the past, I tried to use coast down measurements to do
things like calculate my car's drag coefficient, following a popular
Instructable technique. That does not work. There's too much
inconsistency in the real world to put any sort of stock in those numbers,
especially when it relies on assuming things such as frontal area, air density,
and rolling resistance, and depends on a long coast. The first time I tried, the graph spit out CD
= 0.21 and the second time, with no change to the car, CD = 0.30. Don’t
bother.
By changing the questions you ask and ensuring consistency as much as possible, it looks like you can get usable
information from coast down testing. These will be questions that can be
answered "yes" or "no." Did this change to my car increase/decrease drag? Yes
or no. Did Change #1 increase/decrease drag more/less than Change #2? Yes or
no. Those questions can be answered by coast down testing, as long as the
change is large enough. "What's
the drag coefficient of my car?" cannot, at least not without sophisticated
measuring equipment to account for wind, road grade, barometric pressure, and other factors.
· test from a high speed to a high speed (so that aero drag predominates and test time is kept short)
· test on as flat and smooth a road as you can find and wait for a calm day
· enter the test section at the same spot and same speed each time
· do it lots of times
· be realistic about what the test can show you
·
be consistent—as exactly consistent as
you can!
· confidence test your results to ensure that what you think you see is really there
Good luck!

This comment has been removed by the author.
ReplyDelete